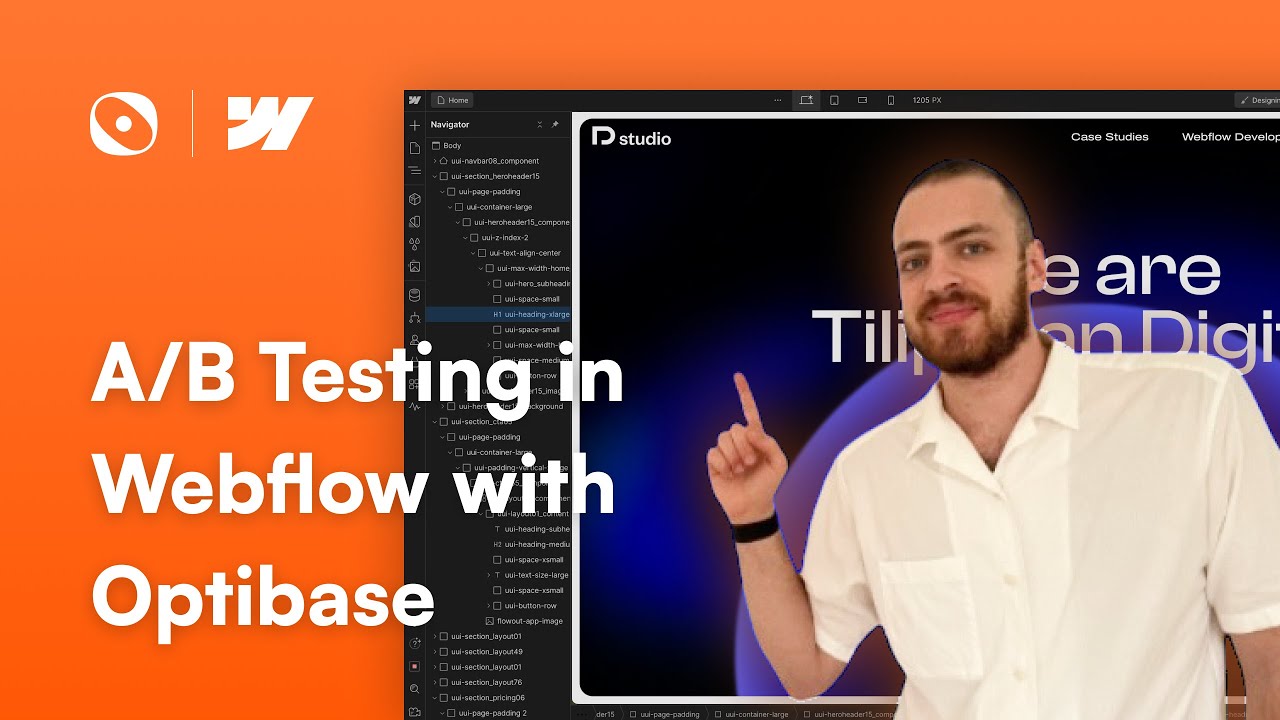
A/B testing Webflow lets you compare different versions of your site to see which one actually works better for real users. It’s a data-driven way to ditch the guesswork and can seriously boost your conversion rates and user engagement.
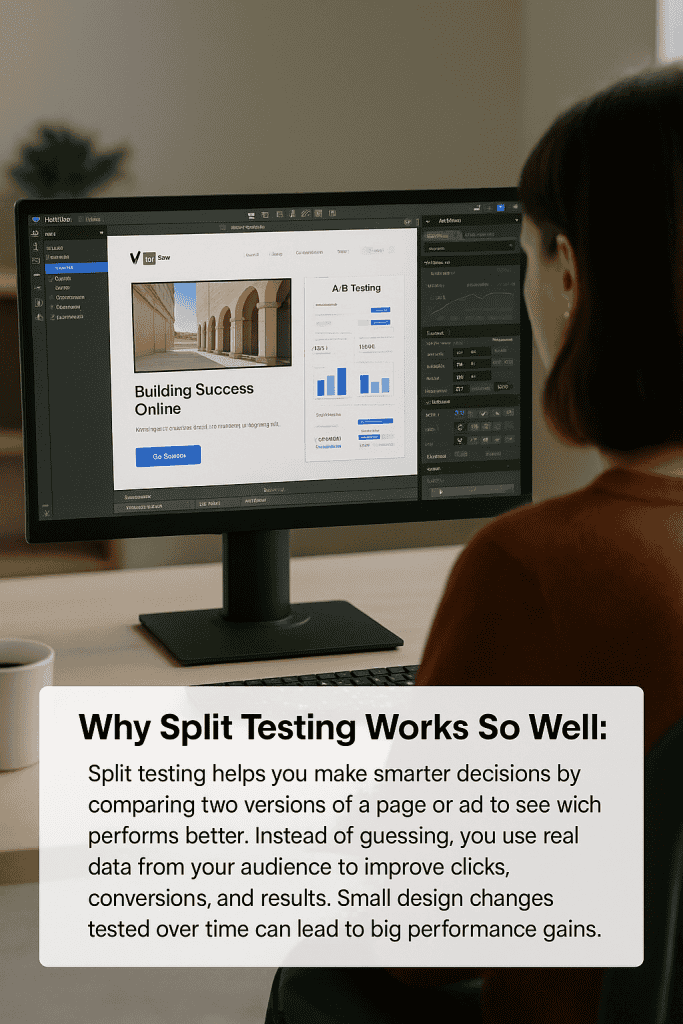
Webflow gives you tons of visual design flexibility and works well with A/B testing tools, so it’s a great platform for running website experiments. A lot of old-school website builders limit what you can test, but with Webflow, you can play around with everything from button colours and headlines to full page layouts—all while keeping things looking sharp.
If you want to set up, run, and actually learn from A/B tests in Webflow, you’ll need to know a bit about the platform and some best practices for testing. Picking the right tools, making smart test variants, figuring out what the results mean, and rolling out the winning changes—there’s a lot to think about, honestly. But it’s worth it if you want your site to really perform.
What Is A/B Testing in Webflow?
A/B testing in Webflow means you compare two versions of a page or element to see which one your visitors actually like more. It’s a way to improve conversion rates and engagement with real data instead of just guessing.
Definition and Principles
A/B testing basically means you take two versions of something (like a web page or even just a button) and see which one performs better. You send some visitors to version A (the original) and others to version B (your new idea), and then you watch what happens.
You can do this in Webflow using built-in tools or third-party apps. A/B testing in Webflow helps you figure out what works best by letting you test different headlines, buttons, or layouts.
The main idea is to use stats to find a winner. Both versions get equal traffic for the same amount of time, but you only change one thing at a time so you know what made the difference.
After the test, you look at the numbers—like clicks, form fills, or purchases—to see which version wins.
Benefits for Webflow Users
Webflow’s mix of visual design freedom, clean code, and easy integrations makes it awesome for A/B testing. You can experiment with almost any part of your site and still keep things running smoothly.
Most template-based builders tie your hands, but Webflow lets you change up colours, fonts, layouts, and interactions—all without needing to code.
Webflow spits out clean code automatically. That means your site loads fast and your tests run reliably on any device or browser.
You can hook up native solutions or outside tools. Popular A/B testing tools for Webflow: Optibase, GA4, VWO, AB Tasty, and Adobe Target. Each one has its own perks.
Common Use Cases
Website owners always test call-to-action buttons to get more conversions. They try different colours, text, sizes, and spots on the page.
Headlines get tested a lot too. Swapping out the message, length, or emotional vibe can totally change how people react.
Forms are another big one. People test the number of fields, the labels, and the layout to cut down on drop-offs. Sometimes shorter forms win, but you never know until you test.
Changing up the navigation menu can help people find stuff faster. Try different menu structures, labels, or positions.
Product pages are huge for sales. Tweak the images, descriptions, pricing displays, or buy buttons and you might see a real difference.
Landing pages benefit from testing hero sections, how you organise content, and what you put front and centre.
Setting Up A/B Testing in Webflow
If you want to run A/B tests in Webflow, you’ll need to prep your project, pick the right things to test, and hook up a good testing tool. Most Webflow sites use third-party tools like Optibase or Google Optimize for this.
Preparing Your Webflow Project
Before you start testing, set a clear goal and figure out your current numbers. Make sure you’ve got analytics tracking set up so you can actually measure what happens.
Decide what counts as a conversion for you—maybe it’s newsletter signups, purchases, or contact form fills. You’ll need to set up event tracking through Google Analytics or something similar for each goal.
Quick prep checklist:
- Install Google Analytics 4 or another analytics tool
- Set up conversion tracking for your main actions
- Write down your current conversion rates and traffic
- Make a testing calendar so your experiments don’t overlap
Your site needs enough traffic to get real results. If you get less than 1,000 visitors a month, your tests might take forever or just not work.
You should also check that your Webflow hosting plan lets you add custom code. Most A/B testing tools need you to drop some JavaScript into your site.
Choosing Testing Variables
The best A/B tests focus on stuff that actually moves the needle. Go for big-impact changes instead of tiny design tweaks.
Good things to test:
- Headlines and value props
- Button text and colours
- Form length and fields
- Page layouts and content order
- Pricing displays and product copy
Test one thing at a time so you know what made the difference. If you change too much at once, you won’t know which thing worked.
The best test ideas usually mean making a real change—like a totally different headline or layout—not just tweaking a colour.
Match your tests to where people are in their user journey. On the homepage, focus on grabbing attention. On checkout pages, focus on getting people to finish.
Integrating Third-Party Tools
Webflow doesn’t have built-in A/B testing, so you’ll need to connect to an outside platform. Optibase is the most popular native A/B testing tool for Webflow. It’s easy to set up and lets you target the right audience.
Popular A/B testing tools for Webflow:
| Tool | Integration Method | Key Features |
|---|---|---|
| Optibase | Webflow App | Native integration, visual editor |
| Google Optimize | Custom code | Free, advanced targeting |
| VWO | JavaScript embed | Enterprise features, heatmaps |
| AB Tasty | Code installation | Personalisation options |
To install Optibase via Webflow Apps, just connect your API key and add some code to your site header. It usually takes about 10-15 minutes.
Google Optimize works by adding tracking codes in Webflow’s custom code section. You’ll also need to link it to your Google Analytics account.
Most tools need you to be on a paid Webflow hosting plan so you can use custom code. The Basic CMS plan or higher gives you what you need.
Creating Effective A/B Test Variants
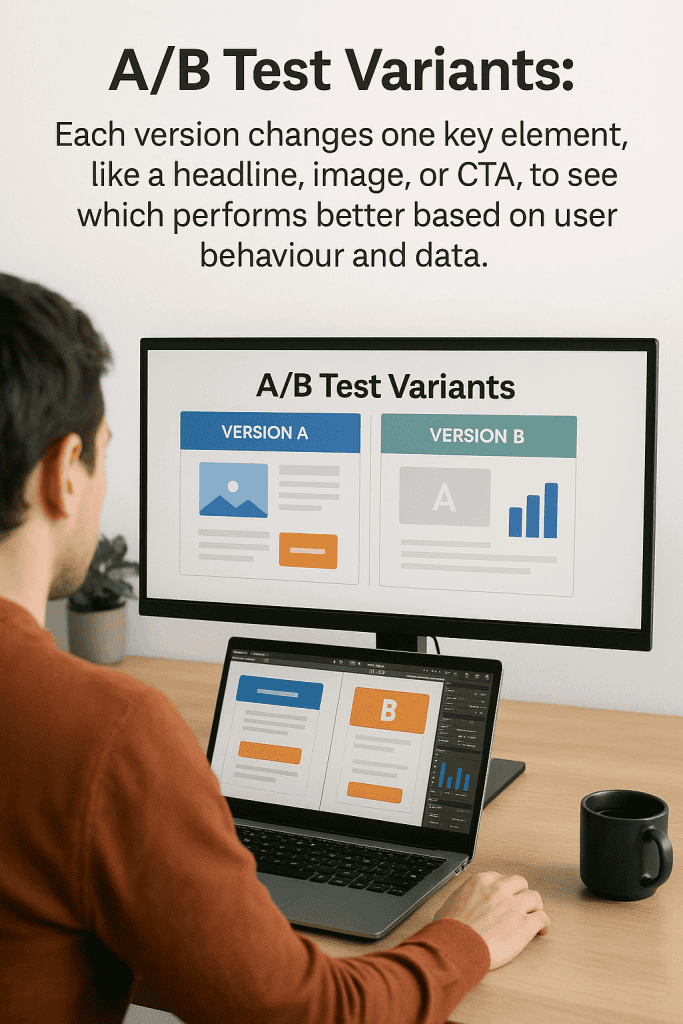
If you want your Webflow A/B tests to work, you need to design your variants carefully. Focus on one thing at a time and try to personalise your content when you can.
Best Practices for Variant Design
Test just one element at a time. If you change a bunch of stuff, you won’t know what caused the results.
Start with the big stuff:
- Headlines and subheadings—try different messages
- Call-to-action buttons—change up colour, text, or where you put them
- Images and videos—see what visuals connect
- Form fields—short vs long forms
Keep your variants looking consistent. You want them to feel like they belong on your site, not like random experiments.
Make real changes between variants. Swapping a button from blue to green probably won’t move the needle. Try a totally new headline or layout if you want to see a difference.
Write down your guesses before you test. What do you think will happen, and why? It’ll help you make sense of the results later.
Make sure you get enough data. You want at least 1,000 conversions per variant for solid results, but sometimes you have to work with what you’ve got.
Content Personalisation Strategies
Segment your audience by where they come from, where they live, or what device they’re on. Different groups respond to different stuff, so personalising can really help.
Try out emotional vs rational copy. Some people want facts, others want a story.
Localise your content if you serve different markets:
- Use the right currency and pricing
- Adjust images and references for different cultures
- Show the right time zones and contact info
- Change up the language or terms
Play with urgency and scarcity. “Limited time offer” vs “Available now”—see which gets more clicks.
Personalise for returning visitors. Maybe remind them what they saw last time, or give newbies a bit more info.
Test different types of social proof. Some people like testimonials, others trust awards or certifications more.
Match your tone to your audience. B2B folks usually want it straight, while B2C likes things more friendly and relaxed.
Implementing and Launching Tests
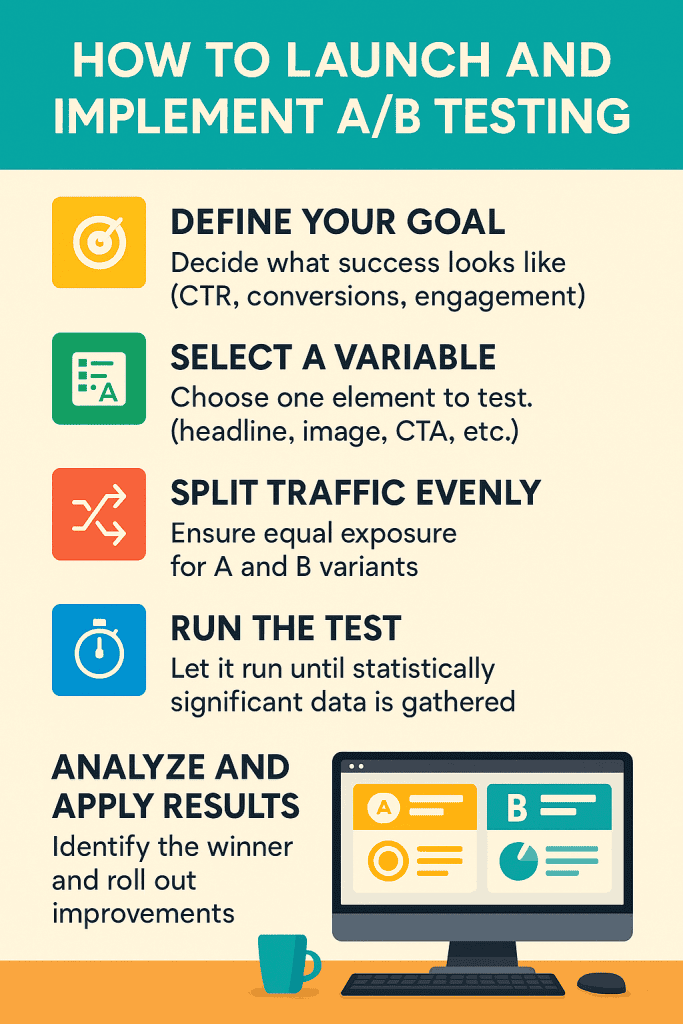
To actually run your tests, you need to split your traffic smartly and pick the right amount of time to let things run. If you mess this up, your test results won’t mean much.
Traffic Allocation Methods
How you split your traffic matters. Most A/B testing tools for Webflow let you choose how much traffic goes to each variant.
Equal Split Testing sends half your visitors to each version. It’s the fastest way to get results with two variants.
Weighted Distribution lets you send more traffic to one version. If you’re testing something risky, you might send 80% to the original and 20% to the new idea.
Sequential Testing means showing one version to a group for a while, then switching. It’s slower but safer for big changes.
Your split affects how long the test takes. If you only send a small chunk of traffic to the test, you’ll need to wait longer for enough data. Optibase and similar tools can help you figure out the best split.
Setting Test Duration
How long you run your test matters a lot. If you stop too soon, your data might be junk. If you run it forever, you waste time.
Minimum Sample Size depends on your current conversion rate and how big of a change you hope to see. You want at least 100 conversions per version for anything meaningful. Obviously, big sites get there faster.
Statistical Significance usually means you want 95% confidence. Webflow A/B testing setups should run until you hit that mark. Don’t call a winner early just because you want to move fast.
Business Cycles can mess with your results. E-commerce sites should think about weekly patterns or sales seasons. B2B sites might need longer to see the full picture.
Most Webflow tests need 1-4 weeks for enough data. Big sites might finish in days, but smaller ones should be patient. Check your numbers every day, but don’t freak out over early trends.
Analysing A/B Test Results
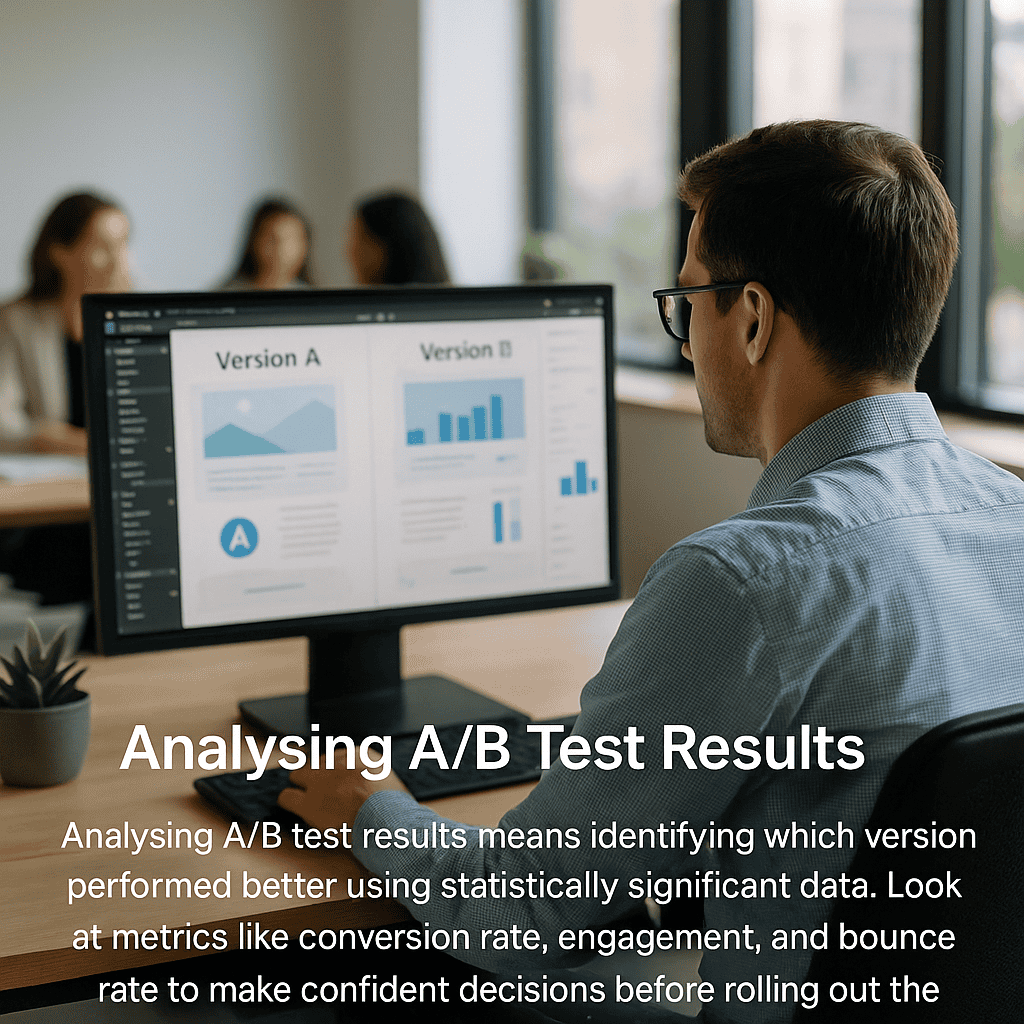
When you dig into test data, you want to focus on specific metrics like conversion rates and click-through rates. You also need to know if your results are legit, and that’s where statistical significance comes in.
Interpreting Webflow Test Data
Conversion rate, statistical significance, and click-through rate are the main things to look at when you’re analyzing a test. These numbers basically tell you which version is winning.
Conversion rates show what percent of visitors take the action you want. So if Version A has a 3.2% conversion rate and Version B hits 4.1%, Version B is the clear winner.
Click-through rates show how many people actually click on a specific thing. If your button gets an 8% CTR versus 5%, the 8% one is obviously doing better.
You can go beyond those basics and look at user experience metrics like page load time, usability scores, and navigation flow. Fast page load times keep people from bouncing, and honestly, nobody likes a slow site.
If your bounce rate drops from 65% to 58%, you know the new version is keeping folks around longer.
Session duration and pages per visit are also good indicators of engagement. Longer sessions usually mean people find your content more interesting or easier to use.
Identifying Statistically Significant Outcomes
Statistical significance is just figuring out if your results are real or a fluke. You want a 95% confidence level before you make any big changes.
Sample size matters a lot. If you get 1,000+ visitors per variation, your data will be way more solid than if you only have 100.
If your p-value is under 0.05, congrats—you’ve got statistical significance. That means there’s less than a 5% chance your results happened randomly.
Let your tests run for at least a week. That way, you’ll catch different user habits on weekdays and weekends.
Sites with a 2% conversion rate need more traffic to spot real changes than sites with a 10% conversion rate. It just takes more data to see what’s actually happening.
Confidence intervals tell you the range where your real conversion rate probably falls. Narrow intervals are better—they mean your results are more precise.
Don’t stop tests early. If you cut things off too soon, you might get the wrong answer. Let them play out for the full planned duration for the most reliable outcome.
Optimising Webflow Projects Post-Test
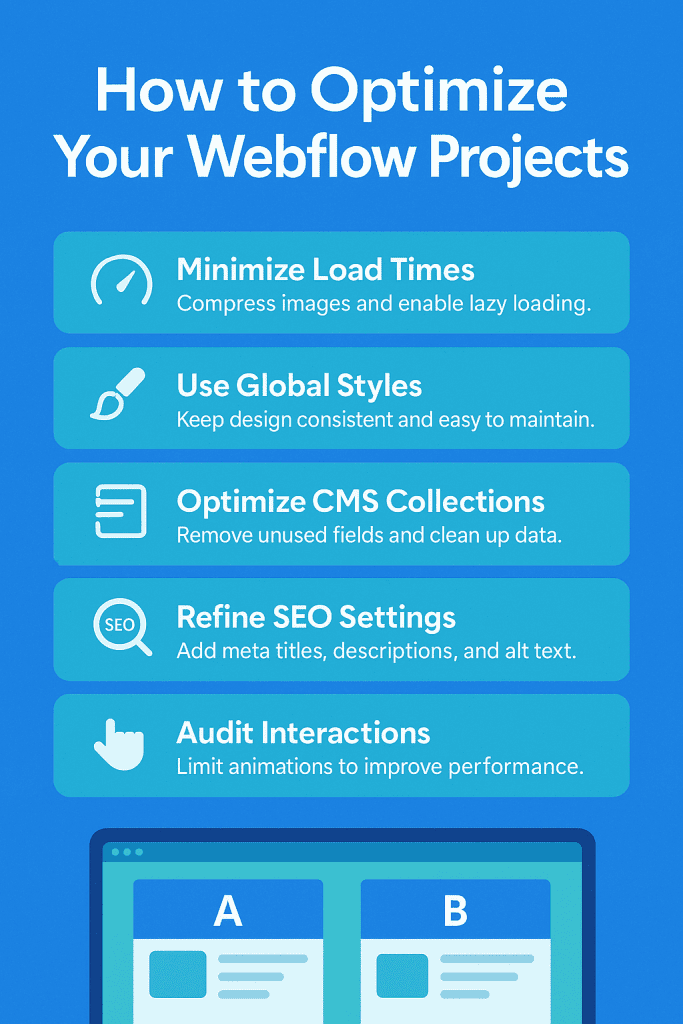
After you finish A/B testing, the real magic is in how you roll out the winning changes and keep testing. Long-term improvements come from actually using your test results and having a plan for future tweaks.
Applying Winning Variants
When your test proves a variant works, you’ve gotta roll it out carefully in Webflow. Start by writing down exactly what you changed so you don’t forget what made the difference.
Here’s a simple checklist:
- Backup creation: Always save the original site as a backup first.
- Gradual rollout: Roll out the winning variant to everyone, but do it in stages.
- Performance monitoring: Watch for any slowdowns or weird bugs after changes.
- Cross-device testing: Double-check that everything works on both mobile and desktop.
Webflow’s visual editor makes it pretty easy to copy over your winning elements to other pages. Just use the copy-paste features and you’re good.
Things to keep an eye on after you launch changes:
| Metric | Monitoring Period | Action Required |
|---|---|---|
| Conversion rate | 2-4 weeks | Compare to test results |
| Page load speed | 48-72 hours | Optimise if degraded |
| User engagement | 1-2 weeks | Adjust if declining |
You’ll need to keep checking in to make sure those improvements actually stick.
Continuous Improvement Cycles
If you want to get the most out of Webflow, don’t just run one test and call it a day. Make testing a regular thing and keep building on what you learn.
A monthly schedule might look like this:
- Week 1-2: Set up and launch new tests.
- Week 3: Keep an eye on your results and collect data.
- Week 4: Go over what you found and plan what to test next.
Iterative A/B testing strategies mean you test one thing at a time—maybe headlines first, then button colors, then forms.
Where should you focus your tests?
- High-traffic pages: Like your homepage, product pages, or checkout.
- Underperforming sections: Any page with high bounce rates.
- Seasonal elements: Holiday banners, promos, stuff that changes.
- New features: Anything you just added to the site.
Keep a log of your tests—what you tried, what worked, and when you rolled it out. That way, you won’t accidentally repeat failed ideas, and your team can learn from past experiments.
Webflow works well with tools like PostHog, so you can keep tracking performance without getting too technical.
Common Challenges and Solutions
A/B testing on Webflow isn’t always smooth sailing. The two main headaches? Sample bias and integration issues—they can mess up your results if you’re not careful.
Avoiding Sample Bias
Sample bias creeps in when your test groups don’t really represent your users. Maybe your sample size is too small, or your traffic isn’t split randomly.
Always randomize your traffic allocation. Some tools split by browser session, not unique visitors, which gets messy if people clear cookies or use different devices.
Minimum sample size depends on your conversion rate. If you convert at 2%, you’ll need about 3,800 visitors per variation to spot a 20% lift. Lower rates mean you need even more traffic.
Watch out for seasonal spikes. Running tests during holidays or big promos can skew your data. Marketing campaigns aimed at certain groups can also throw things off.
Make sure your device and browser split matches your usual traffic. If mobile and desktop users act differently, uneven splits can give you false results.
Troubleshooting Integration Issues
Integration hiccups can stop your test from running right or mess up your data. Webflow’s code setup is a bit different from other platforms, so you need to adjust your approach.
If you have script loading conflicts, it’s probably because tracking tools are fighting each other. Load your A/B test scripts before analytics code, and stick them in the head, not the footer.
CMS collection problems pop up when you try testing dynamic content. Webflow’s CMS can get weird if you tweak collection templates. Stick to static elements at first, then move to dynamic stuff once you’re comfortable.
Custom code can break your tests. Third-party widgets or custom JS sometimes override test assignments. Open up browser dev tools and look for errors if things aren’t working.
Publishing delays are real on Webflow. Changes don’t show up instantly. Tools like Optibase handle this behind the scenes, but if you go manual, you’ll need to time things right.
Advanced A/B Testing Strategies for Webflow
If you want to level up, try testing multiple elements at once or targeting specific user groups. Advanced A/B testing strategies like multivariate tests and personalized user segmentation help you optimize whole experiences—not just single elements.
Multivariate Testing
With multivariate testing, you can test several page elements at the same time. This way, you see how different headlines, images, and buttons work together.
Instead of just comparing two versions, you check multiple combinations. Say you try three headlines and four button colors—that’s 12 possible combos.
What should you test together?
- Headlines and subheadings
- Call-to-action buttons and where you put them
- Images and videos
- Form fields and layouts
You’ll need more traffic for this to work—at least 1,000 visitors per week is a good rule of thumb.
The biggest perk? You find out how elements interact. Maybe a red button works with one headline but flops with another. These insights help you build the best possible page.
Personalisation with User Segmentation
User segmentation lets you create targeted experiences that actually make sense for different visitors. People respond to totally different messaging and designs, depending on who they are.
Common segmentation criteria:
- Traffic source: Organic search, paid ads, or maybe social media
- Device type: Mobile, desktop, or tablet
- Geographic location: Where in the world someone’s browsing from
- Return visitors: New folks vs regulars
You can serve up content that fits each group’s needs. For example, mobile users might get a simpler layout, while desktop folks see all the details.
Webflow’s CMS makes dynamic content delivery pretty easy. You can set up custom fields for different text, images, or layouts for each group.
Usually, this approach bumps up conversion rates by about 15-25% over generic experiences. It’s smart to start broad and then fine-tune your targeting as you go.
